In Cisco Unified Contact Center Express (UCCX), a queue is a container for holding incoming calls until an available agent is available to handle them. A Contact Service Queue (CSQ) is more advanced, using an algorithm to determine call routing—whether it's within the queue or directly to an agent.
In QLive, you can pull a Cisco UCCX Contact Service Queue (CSQ) report to get a detailed overview of your queue and agent performance. These reports enable you to assess how efficiently your queues and agents are operating, allowing you to optimize your customer service strategy.
How to Build a UCCX CSQ Report Showing Key Statistics
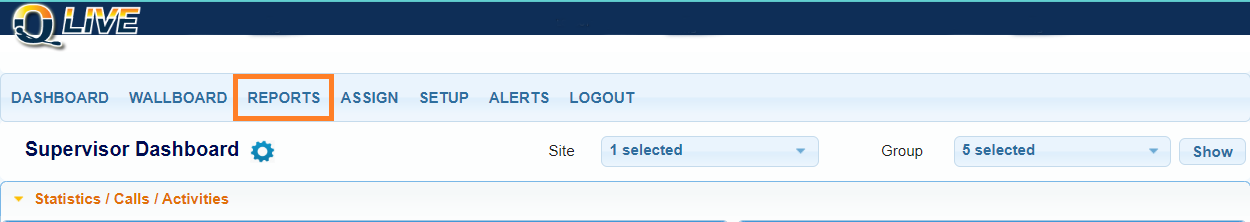
Step 1: Navigate to Queue Reports
- Once logged into the QLive dashboard, select the Reports
- Navigate to the Queue Reports
- Expand the options under Queue Reports and select "Group/Queue Summary by Day"
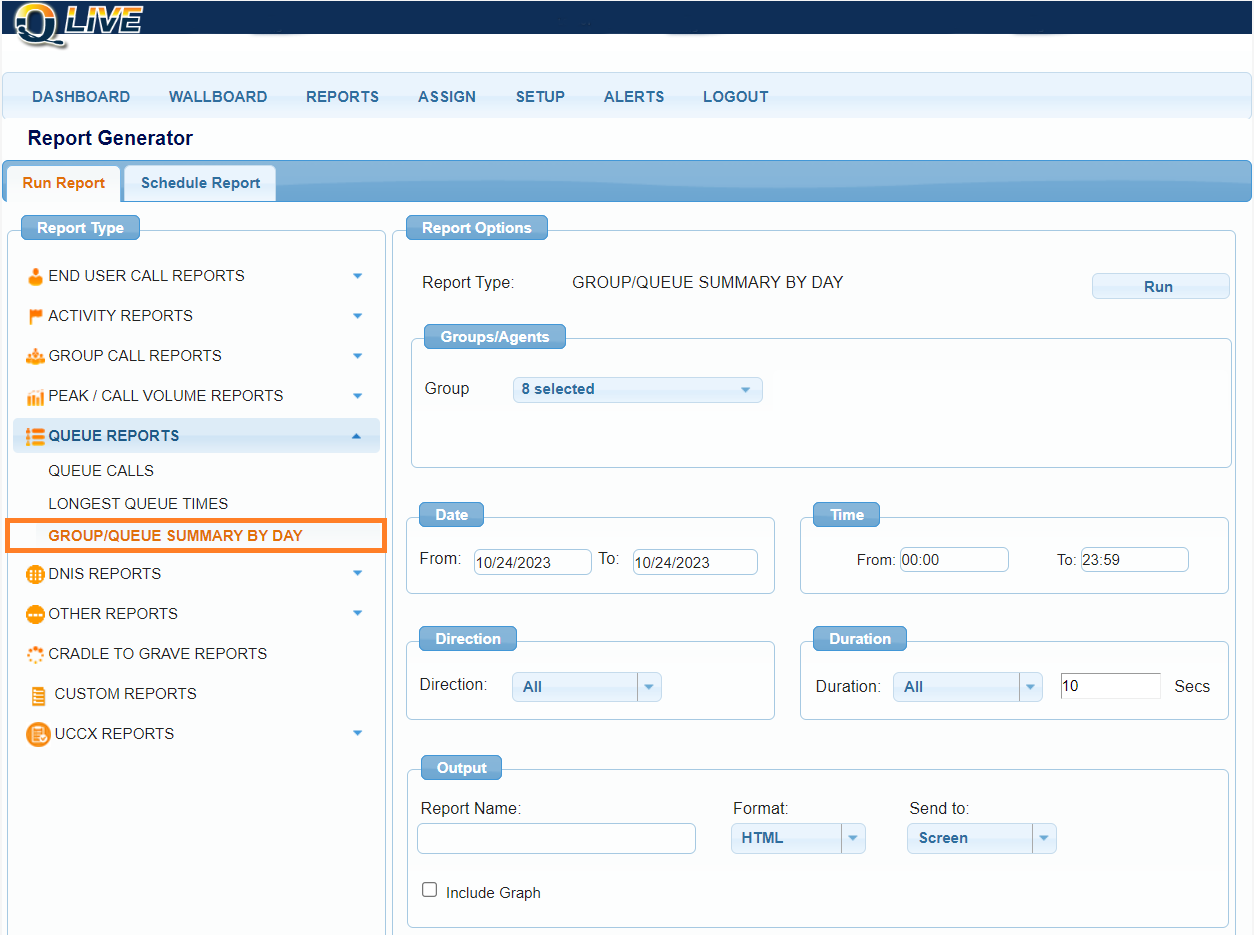
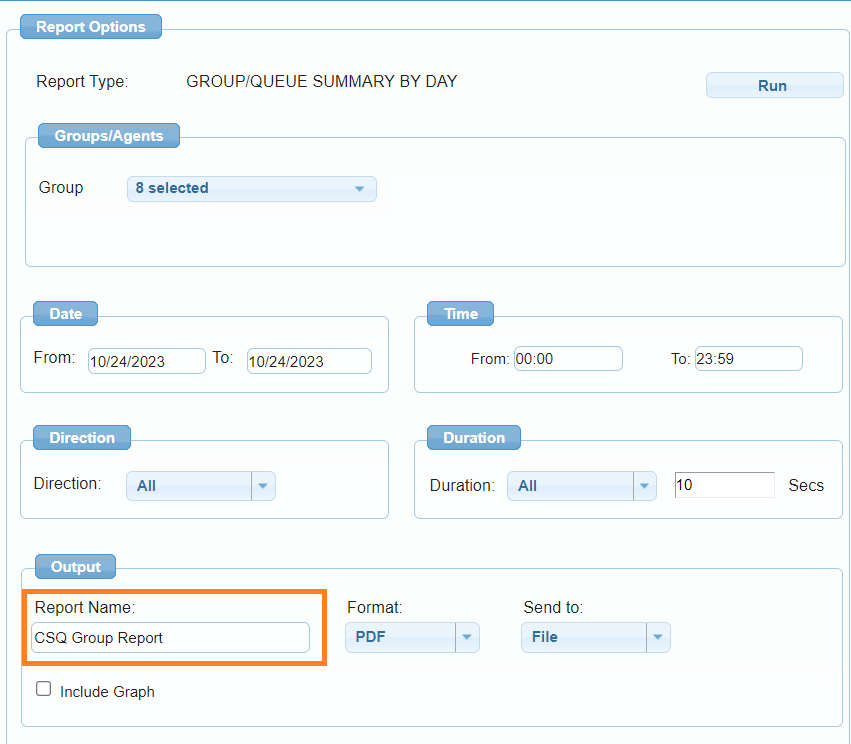
Step 2: Configure CSQ Report Settings
- In the Report Name field type a name for your report. This name will also be the name of the file you download
- From the CSQ Group dropdown, select the UCCX CSQ group for which you want to generate the report
- Optional: Adjust the Date Format and Time Format according to your preference
- Select your preferred report format to download: HTML, PDF, or CSV
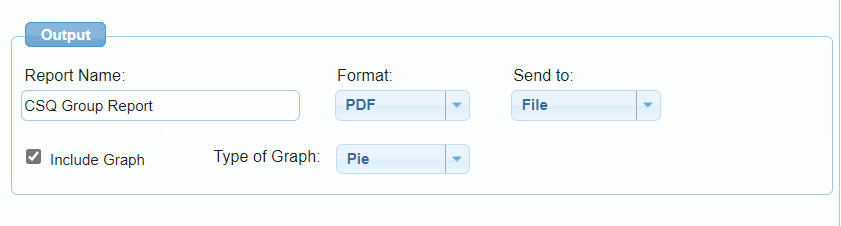
Step 3: Include Data Graphs (Optional)
- If you wish to include graphical data, check the box next to Include Graph
- Select the type of graphical display you prefer: Pie, Donut, Column, Horizontal Bar, or Line.
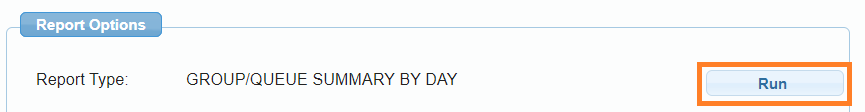
Step 4: Generate the UCCX CSQ Report
- Click on the Run button to generate a report that includes the CSQ statistics and graphical data based on your configuration.
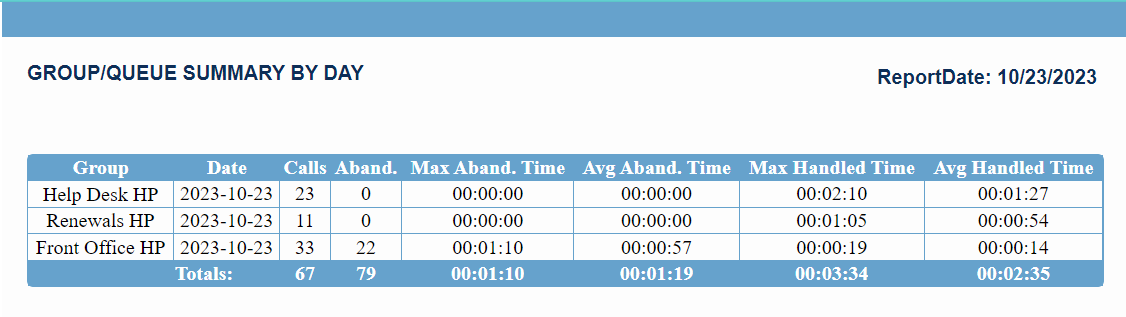
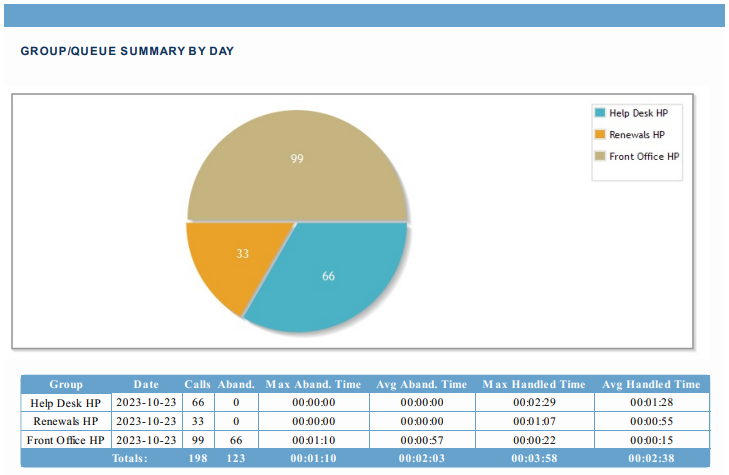
Down the CSQ Report and Review KPIs/Metrics
Once the report is generated, it can be downloaded to review the key CSQ statistics:
- Total Call Count
- Abandoned Count
- Maximum Abandoned Time
- Average Abandoned Time
- Maximum Handled Time
- Average Handled Time
- Longest Queue Times
Metropolis' QLive offers comprehensive UCCX Reporting and includes call summary reports for your Contact Service Queues (CSQs). This guide will walk you through the steps to create a report that includes key statistics like total call count, abandoned count, and average handled time.