
Webex Contact Center (WxCC) is a cloud-based customer service and support platform developed by Cisco. Out of the box, the native reporting in WxCC provides a solid foundation for monitoring and analyzing contact center performance. However, as contact centers transform from simple call-handling operations into sophisticated customer engagement hubs, many leaders discover that WxCC's built-in analytics tell only part of the story.
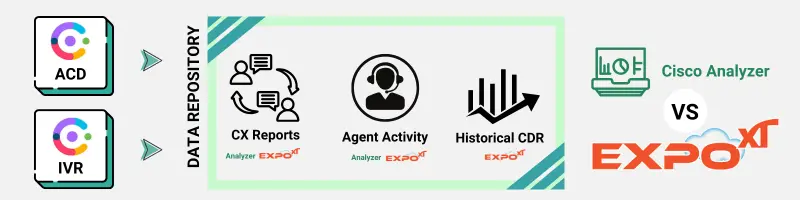
At the foundation of WxCC's analytical framework sits the Cisco Analyzer tool—a versatile engine that harvests both real-time and historical data across the contact center environment. The platform's reporting arsenal includes:
Stock Reports: Standardized reports covering metrics such as agent activity, queue performance, and multimedia channel usage.
Custom Reports: User-defined reports tailored to specific business needs.
Dashboards:Visual representations of key performance indicators (KPIs) for quick insights.
Scheduled Reports: Reports can be setup on schedules for automatic generation and email distribution.
Multimedia Support: Comprehensive reporting across voice, email, chat, and social media channels.
By consolidating data from across the Webex ecosystem, the Analyzer enables teams to filter and segment information by critical parameters like agent name, team designation, or customizable time intervals. These capabilities serve as valuable compass points for navigating daily operations and identifying immediate concerns.
But as many organizations discover when they venture beyond basic reporting needs, WxCC's native analytics begin to reveal their boundaries just when deeper insights become most crucial.
Despite its strengths, Webex Contact Center's reporting system faces several significant limitations that can impact a contact center’s ability to make data-driven decisions:
Limited Historical Call Trend Data: Accessing comprehensive historical data beyond 30 days often proves frustrating for teams needing to analyze long-term patterns. This restriction makes it difficult to identify seasonal trends or year-over-year comparisons that could inform strategic planning and resource allocation. As noted in this Cisco UC community thread, prebuilt WxCC reports lack historical abandoned-call trends without customization.
Lack of Advanced Analytics: The platform's native tools fall short in delivering predictive analytics and AI-driven insights that modern contact centers increasingly rely on. Critical advanced metrics—such as first-call resolution rates or agent-specific customer satisfaction scores—remain unavailable, while the rigid predefined time intervals (daily, weekly, monthly) restrict flexible trend analysis that could reveal important operational patterns.
Custom Visualization Constraints: WxCC dashboards offer only basic visualization options, limiting your ability to create compelling, complex data representations or incorporate external data sources for contextual analysis. Many users express frustration with the limited export functionality, which primarily supports Excel or XML formats, creating barriers to seamless integration with other business intelligence systems.
Insufficient Queue Analysis: While the Queue Analyzer tool provides basic metrics, it lacks the depth needed for sophisticated queue management. Teams struggle to segment performance data by crucial variables such as time of day or customer demographics. More problematically, when investigating call abandonment, the system offers little insight into the customer journey prior to disconnection—whether they experienced lengthy holds, multiple transfers, or other friction points. Without predictive modeling capabilities, contact centers also miss opportunities to anticipate and prepare for call volume fluctuations.
Basic Agent Performance Reports: The system captures fundamental metrics like login times and occupancy rates but falls short in providing nuanced insights into agent productivity patterns. Contact center managers need more detailed breakdowns of how agents allocate their time across activities—active call handling, idle periods, and wrap-up work—to identify optimization opportunities and develop targeted coaching approaches.
Call Quality and Latency Metrics: The Analyzer notably lacks crucial technical performance indicators such as jitter, packet loss, and latency—metrics essential for diagnosing voice quality issues. While this data exists within the Webex Calling Reports and Analytics APIs, the separation between operational and technical reporting creates an inefficient workflow for teams needing a holistic view of system performance. This fragmentation complicates troubleshooting efforts and can delay resolution of customer-impacting technical issues.
Understanding these limitations is the first step toward identifying solutions that can transform your contact center data from basic metrics into actionable intelligence that drives meaningful business outcomes.
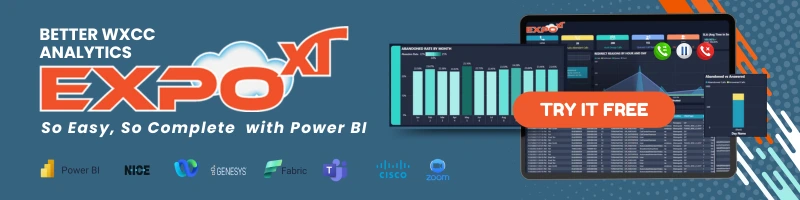
Expo XT is a UC Analytics platform that is built on Microsoft Power BI to transform raw CDR records and contact center data into business intelligence report and analytics that are easy to use for voice engineers, call center administrators, and even customer service agents. The software includes combination addresses for each WxCC shortcoming with purpose-built solutions.
Where data was once constrained to 13 months, Expo XT stores information externally in Power BI datasets or connected warehouses, enabling organizations to:
Retain performance data indefinitely
Analyze multi-year trends for seasonal patterns
Compare year-over-year metrics efficiently
Base decisions on comprehensive historical context
Visualization constraints disappear within Expo XT's flexible environment. Leaders can create dashboards featuring heat maps of hourly call volumes, forecasting trend lines, and detailed agent reports. These dashboards integrate multiple data sources — WxCC metrics, Webex Calling data and call quality scores—into unified views that reveal complete customer experience narratives.
For queue analysis challenges, Expo XT provides exceptional clarity. When investigating abandoned calls, supervisors can:
Trace the customer's journey before disconnection
Identify precise abandonment triggers
Determine whether holds, transfers, or network issues contributed
Forecast peak periods to optimize staffing proactively
Supervisors gain access to multidimensional agent scorecards with Expo XT that reveals not just when agents are active, but precisely how they allocate time across different activities: active conversations, after-call work, idle periods, etc.
The platform's natural language querying allows anyone to type questions like "show average wait times for premium customers last Thursday" and receive immediate visualized answers. This accessibility transforms reporting from a technical function to an organizational capability. Plus, Power BI flags anomalies, detects sentiment patterns, and identify correlations between variables, drawing conclusions that may have otherwise been missed.
By addressing WxCC's reporting limitations comprehensively, Expo XT converts contact center data into actionable intelligence that drives operational excellence and enhances customer experiences.