QoS Analytics & Call Quality Reporting with Expo XT

Your UC system provides call data, but finding the root cause of poor audio shouldn't be a manual chore.
Expo XT helps IT and telecom teams monitor UC quality metrics across Webex, Cisco, Zoom, and Teams through centralized QoS analytics and operational dashboards.

Standardize your troubleshooting workflow and gain actionable insights into network hotspots, remote worker degradation, and historical quality trends.

Critical Voice Quality KPIs at a Glance

Surfacing immediate operational visibility for ongoing UC performance management.

Total & Poor

Call Volume & Poor Call Rate

P95 Jitter

Audio Jitter Performance

P95 Latency

End-to-End Delay Metrics

Avg Loss %

Packet Loss Degradation

Screenshot of Expo XT for Troubleshooting Call Quality

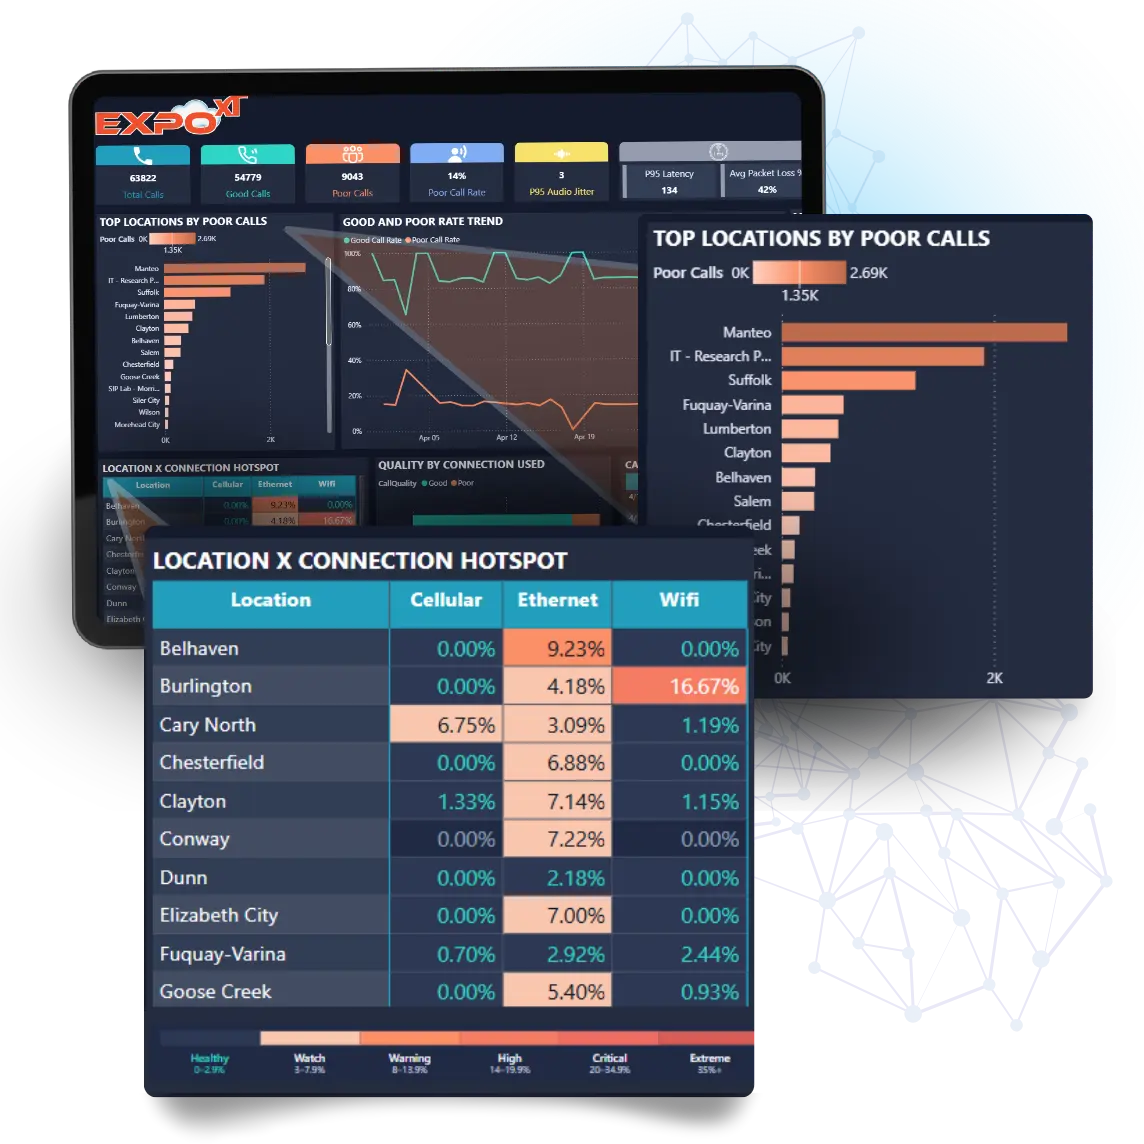
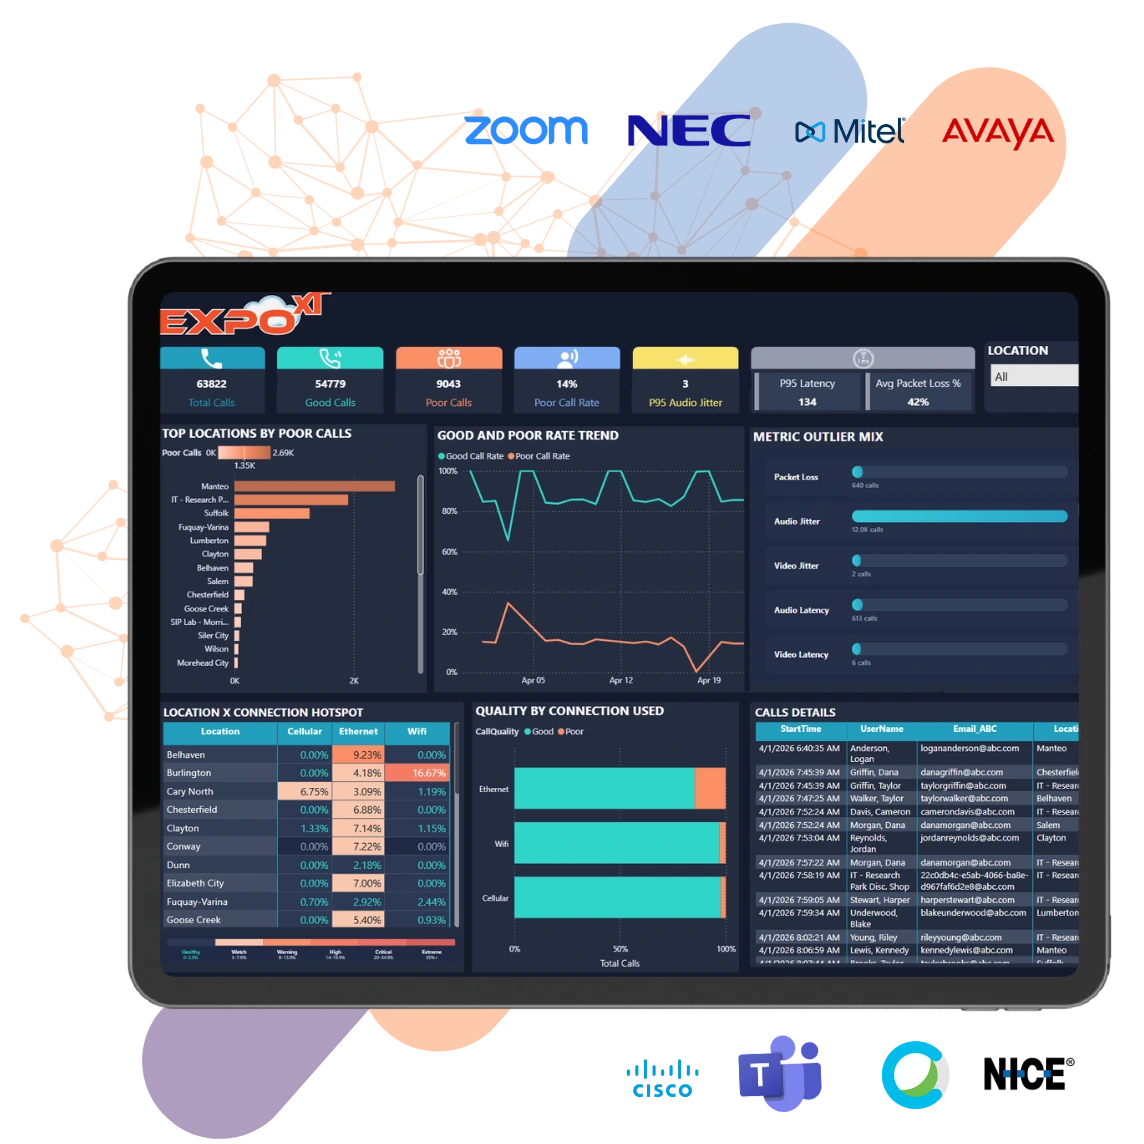
Troubleshoot Poor Call Quality Faster

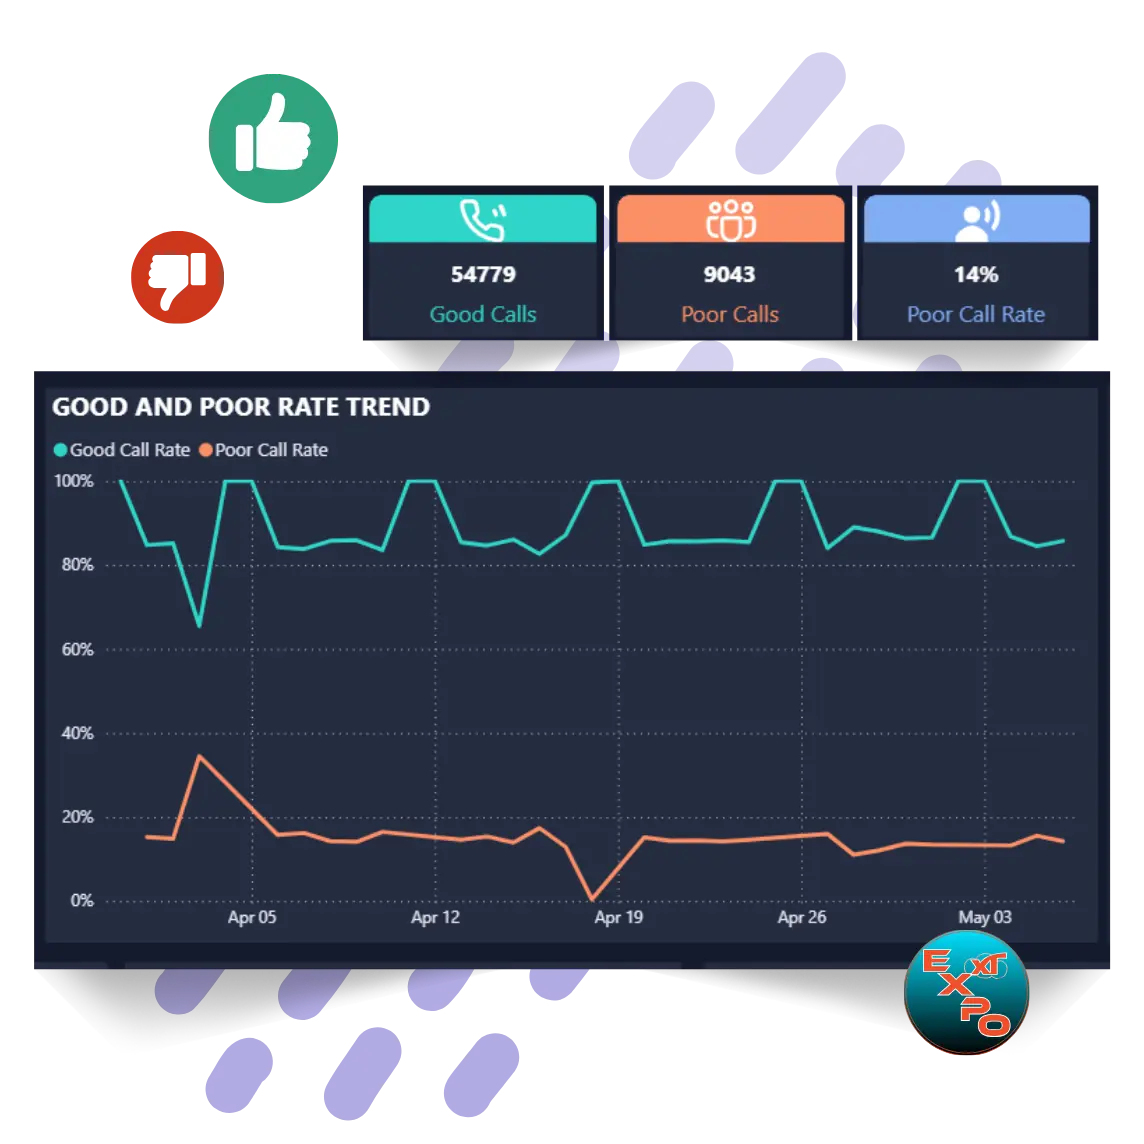
When users report robotic audio, intermittent drops, or one-way audio, support teams need more than raw logs. Expo XT centralizes quality reporting into a single operational dashboard to quickly isolate:

  • Network Instability
  • Wi-Fi Congestion
  • WAN Issues
  • Remote Worker Degradation
  • Endpoint Problems
  • High Latency Connections
  • Packet Loss Spikes
  • Jitter-related Distortion

Identify Locations With Recurring Problems

Distributed workforces create complex troubleshooting challenges. Expo XT helps teams identify offices, regions, and geographic hotspots generating high volumes of degraded calls.

  • Regional Trend Analysis: Correlate quality metrics to physical locations to prioritize remediation efforts.

  • Network Hotspots: Identify unstable Wi-Fi environments and degraded remote worker regions.

  • Historical Patterns: Track site-level degradation and recurring WAN performance issues over time.

  • QoS Tip
  • Monitor trends over peak congestion periods
QOS Location Hotspot Reporting dashboard

Analyze Quality by Connection Type

Voice quality varies dramatically depending on how users connect. Expo XT helps teams compare call performance across Ethernet, Wi-Fi, and Cellular networks.

This visibility determines whether poor quality is driven by wireless instability, ISP performance, or local network congestion.

Unstable Wi-Fi

Detect congestion in home and branch offices.

ISP Performance

Identify regional network hotspots and risk areas.

Detailed Call-Level Troubleshooting Analytics

When escalation occurs, operations teams need searchable, granular data to isolate affected users.

Searchable Data Points Include:

  • Start Time
  • User Name
  • Email Address
  • Location
  • Country
  • Connection Type
  • Call Quality Rating
  • Endpoint Info

Reduce Mean Time to Resolution: Move beyond reactive troubleshooting. Expo XT provides the proactive monitoring required for hybrid workforce environments, helping you focus on the underlying source of user experience issues.

Built for Enterprise UC Operations Teams

Standardize troubleshooting workflows and compare metrics across your entire collaboration environment.

Cross Platform QoS Analytics Dashboard

Multi-Platform Support

Centralized QoS analytics for Webex Calling, Cisco Unified Communications, Zoom Phone, and Microsoft Teams.

Executive Visibility

Historical reporting, long-term trending, and executive scorecards to track overall communication health.

Data Retention

Extend operational insight beyond the limited retention windows often found in native UC reporting tools.

Try Expo XT's QoS Analytics

See how Expo XT helps organizations monitor QoS metrics, identify poor call trends, troubleshoot voice degradation, and improve operational visibility across unified communications environments.